Continuous vibration and tilt measurement on structures. Internal battery or 12 – 24 VDC supply, data over the mobile network.
SensorMeasures continuously
LTE-M / NB-IoT every hour
CloudStores all records
HTTPS
Dashboardasense.semitronica.ptAPIFor your own software
What it measures
Acceleration
3 axes. Average, maximum and minimum every hour, plus the frequency spectrum.
Rotation
3-axis gyroscope.
Tilt
Inclination of the sensor, every hour.
Vibration events
40 s of continuous recording at 50 Hz, around the strongest vibration of each hour.
Optional inputs
Wind meter (RS-485) and two strain gauge inputs.
Also
Ambient temperature, GPS position.
1
Mounting
Fixed firmly to the structure or a pole · vertical · X axis up · cables down.
On a wall or structure
Choose a flat, rigid spot on the structure. The sensor must move with the structure, not on its own.
Hold the sensor vertical, with the X axis pointing up and the cable connectors on the bottom face.
Fix it through the four flange holes (Ø 5 mm). Tighten until the sensor cannot move.
Check the angle: the sensor must be less than 2° off vertical.
Why vertical? The tilt readings are measured from this position. A sensor fitted at an angle starts with an offset.
On a pole
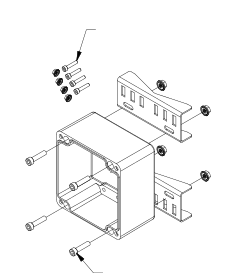
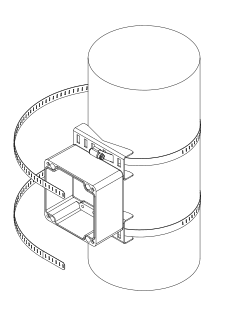
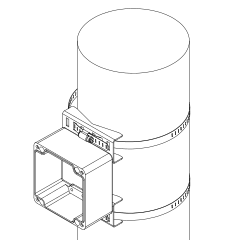
Round pole · 2 brackets · 2 clamps. Keep the X axis up and the connectors down.
You need
3 mm hex key, for the bracket screws
7 mm nut driver, for the flange nuts
8 mm nut driver or socket, for the clamps
Pole diameter
3.8 to 17.8 cm (1.5 to 7 in, supplied clamps)
Check the kit: two brackets, four screws and four flange nuts. If the kit has two sizes of screw, use the ones that fit through the flange holes.
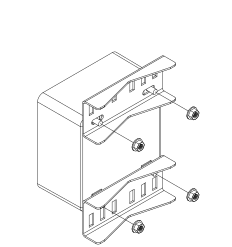
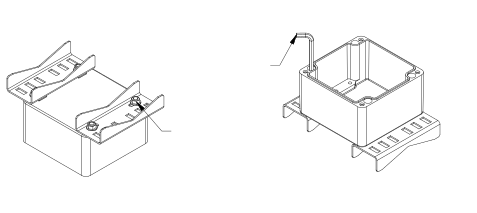
Fit a bracket at the top and one at the bottom, through the four flange holes. Put a flange nut on each screw.
Hold each screw with the hex key and tighten its nut with the 7 mm nut driver, to 1.5 N·m. Do not overtighten.
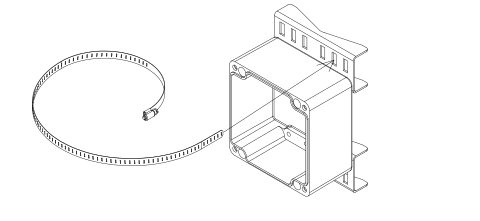
Thread a clamp through a slot in each bracket. Pick the slot that lines up with the pole.
Wrap both clamps around the pole and thread each one back through its bracket.
Hold the sensor against the pole, X axis up, and tighten both clamps with the 8 mm nut driver. Check it is less than 2° off vertical.
2
Wiring
One connector for power and RS-485 · one connector for strain gauges (option).
POWER + RS485 connector
Supply 12 – 24 VDC. The wind meter and other RS-485 sensors share this connector.
Pin
Function · wind meter cable colour · power cable colour
1
RS485-B · black · –
2
0 V · blue · white
3
RS485-A · white · –
4
12 / 24 VDC · brown · brown
AIN connector (strain gauge option)
Two half-bridge inputs. The reference half-bridges are inside the sensor.
1
Common (0 V)
2
Input B (AIN2+)
3
Input A (AIN1+)
4
Reference voltage 2.5 V
3
First connection
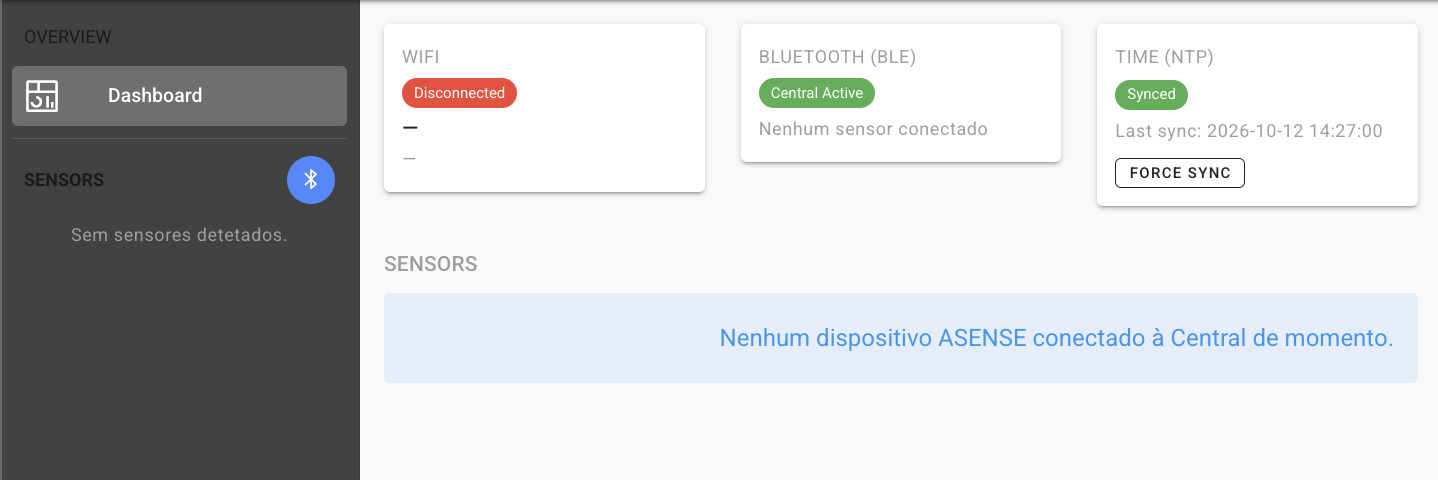
Use central.semitronica.pt on site, next to the sensor, to check it works.
Phone or laptop with Bluetooth and a supported browser (table below).
Sensor powered (internal battery or 12 – 24 VDC supply). Bluetooth is on whenever it has power.
Stand next to the sensor. Bluetooth reaches a few metres. Out of reach? Our Asense Central hub has a long-range link to the sensors and works as an extender. Ask us about it.
Windows
macOS
Linux
Android
iOS
Chromium browsers (Chrome, Edge)
✓
✓
✓ flag
✓
✕
Firefox, Safari
✕
✕
✕
✕
✕
Browsers with Web Bluetooth
–
–
–
–
✓
Linux: turn on one flagIn Chrome, open chrome://flags/#enable-experimental-web-platform-features, set it to Enabled and restart Chrome. Without it, web pages cannot use Bluetooth on Linux.
Pairing timea few minOn some phones and computers pairing takes a few minutes. Wait before retrying.
1
1Open central.semitronica.pt. Click the Bluetooth icon next to SENSORS.
2Select ASENS-… in the list and click Pair. 3Info tab: the sensor shows Connected. Check the serial number matches the label.
Tabs worth a look
Sense
The current hourly values: acceleration average, maximum and minimum, tilt, main frequencies, supply voltage, inputs A and B, temperature and wind.
ACC · Gyro
Live acceleration and rotation on 3 axes. Tap the structure and watch it respond.
FFT
The current frequency spectrum of each axis.
Central is for checking the sensor on site. Your measurements are in the cloud dashboard and the API.
4
Cloud dashboard
Addressasense.semitronica.pt/dashboardAny current browser, any device.
Your API keyAlso used for the API (chapter 6).
12
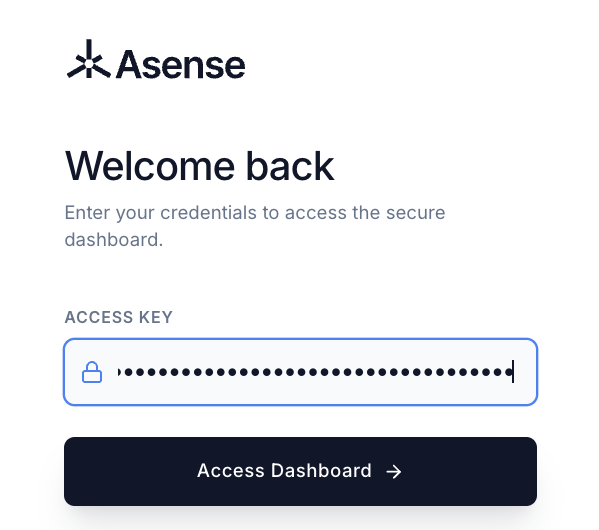
1Paste your API key in ACCESS KEY. 2Click Access Dashboard.
3
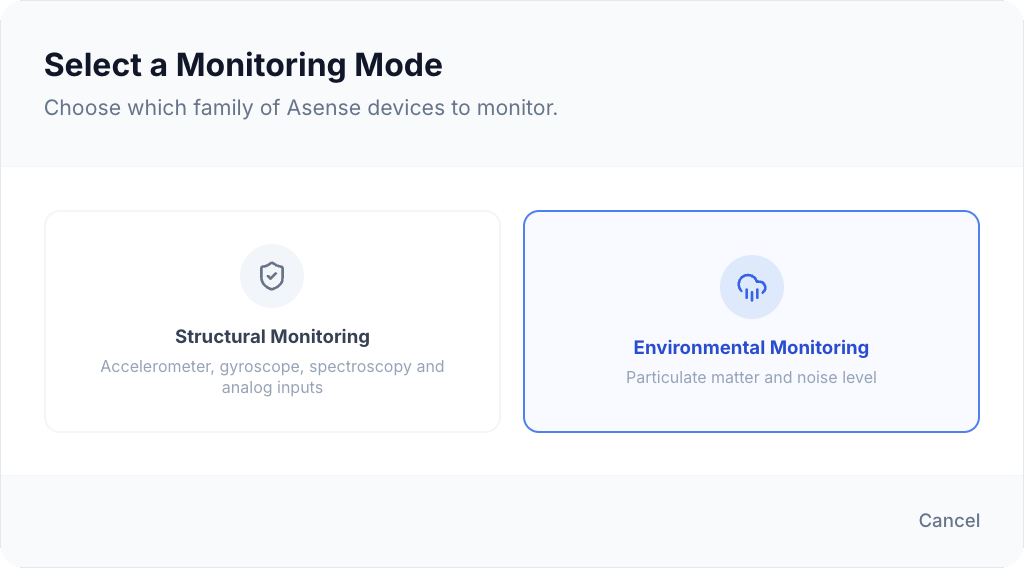
3Select Structural Monitoring.
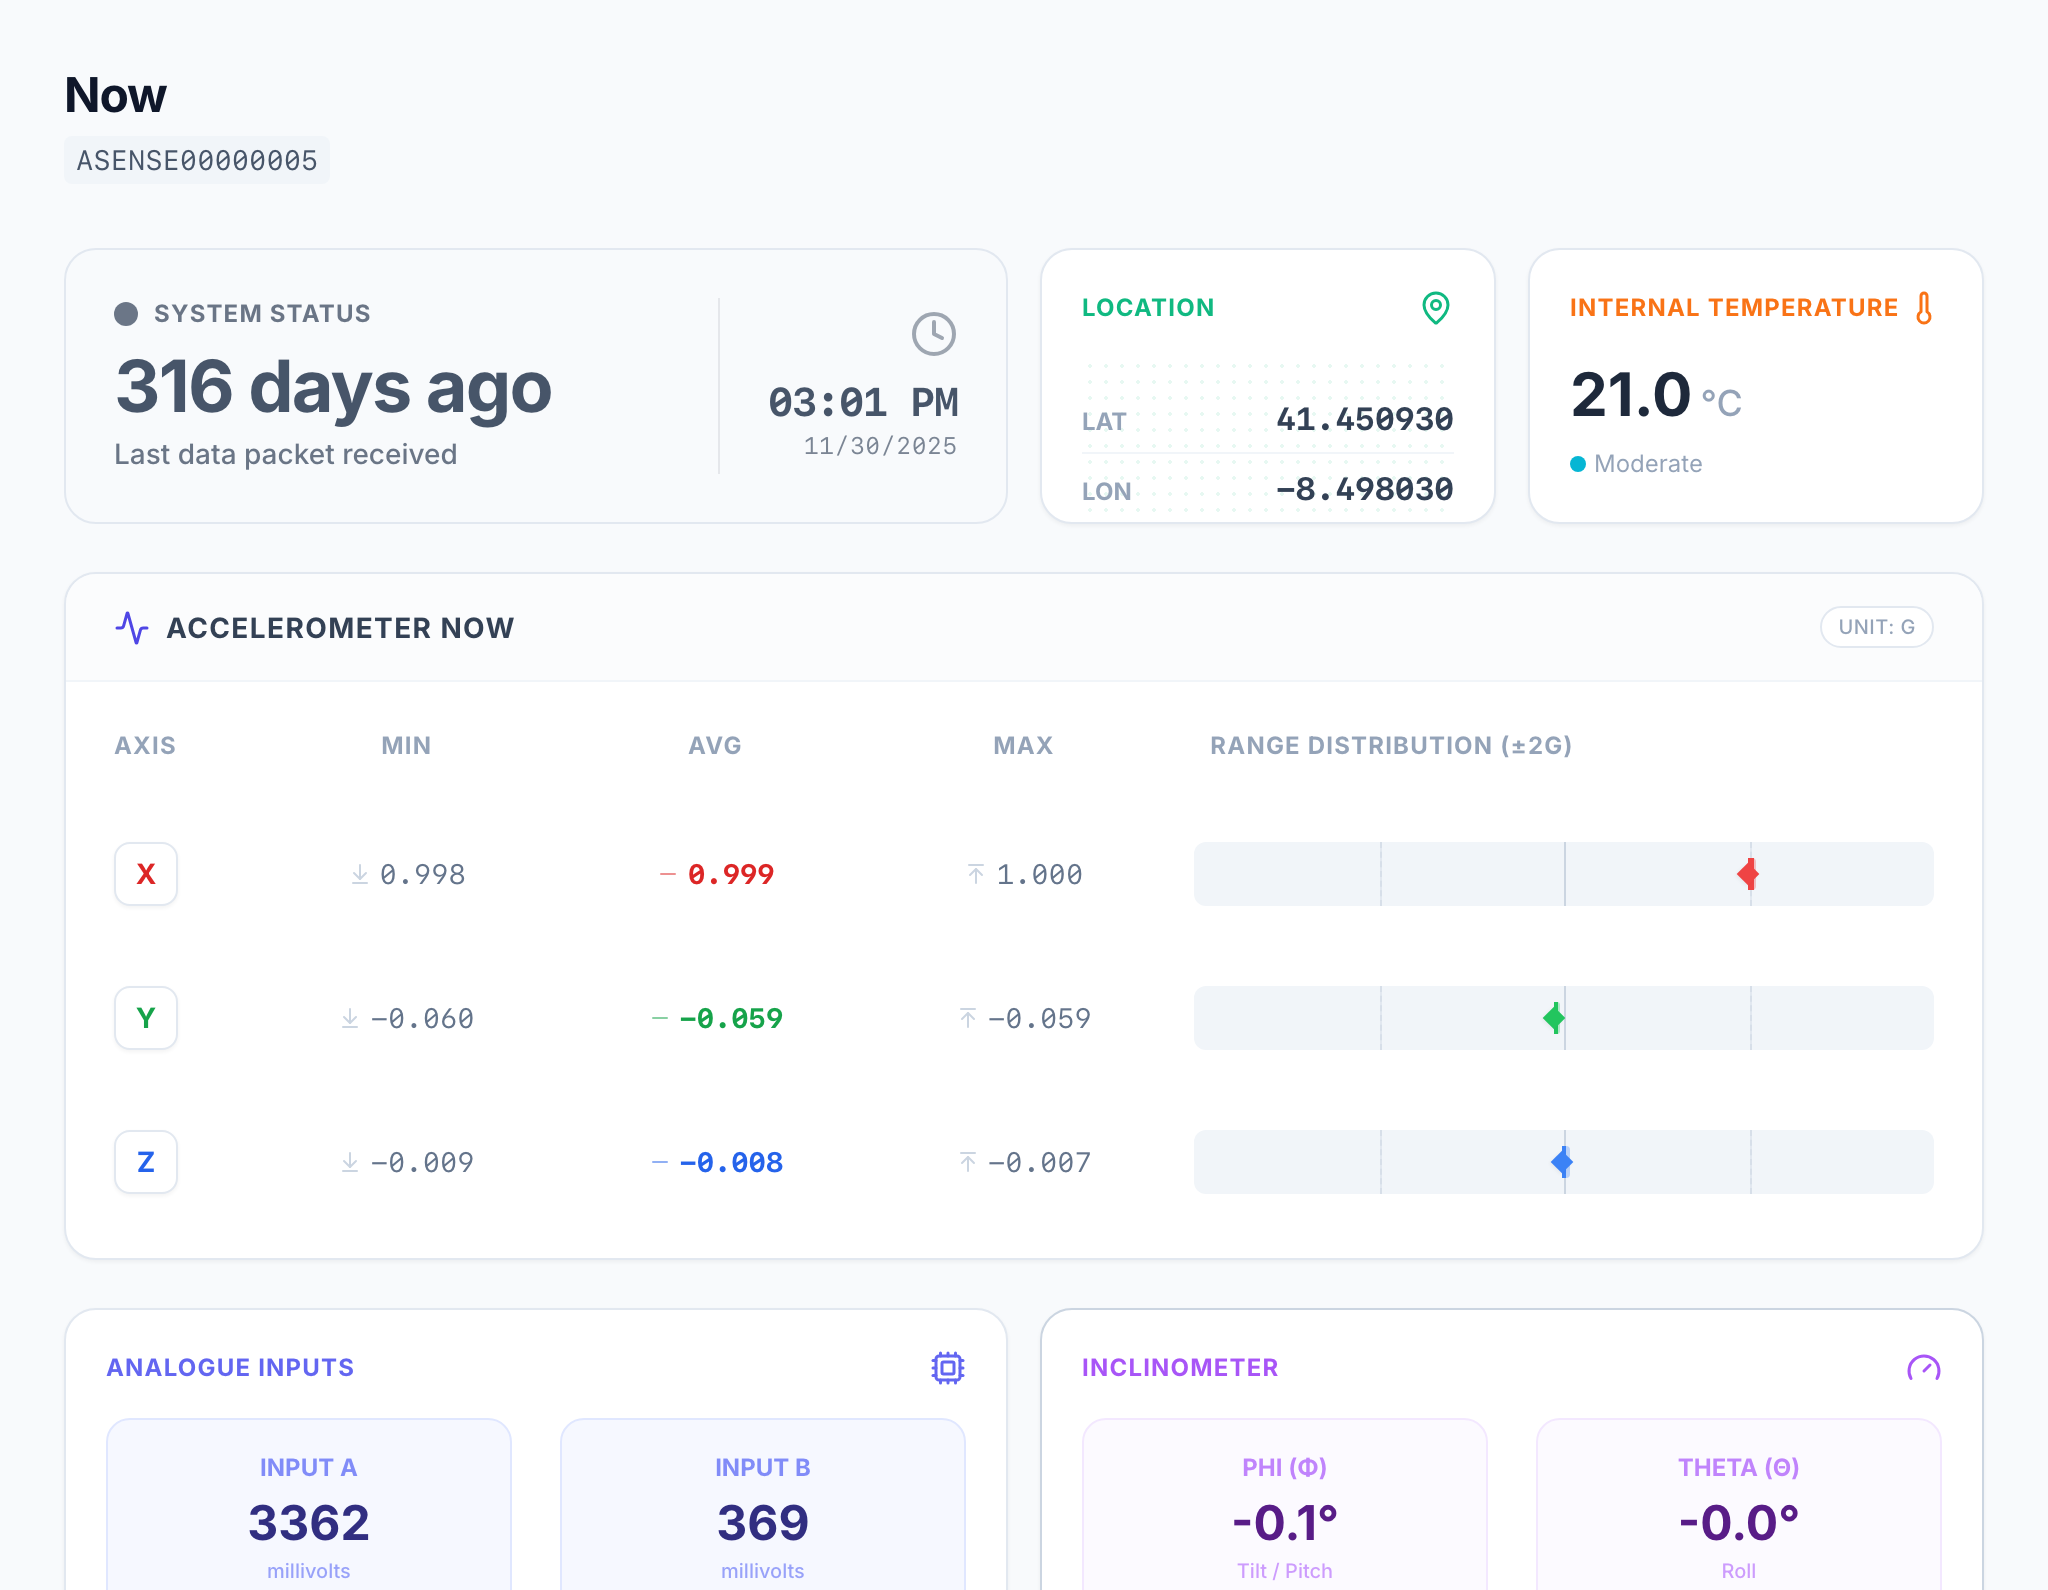
Now: latest hourly summary
ABCDE
A
System status Time since the last data packet. Normally under 1 h.
B
Location · temperature GPS position and temperature.
C
Accelerometer Minimum, average and maximum of the hour, per axis (g).
D
Analogue inputs Strain gauge inputs A and B.
E
Inclinometer The two tilt angles.
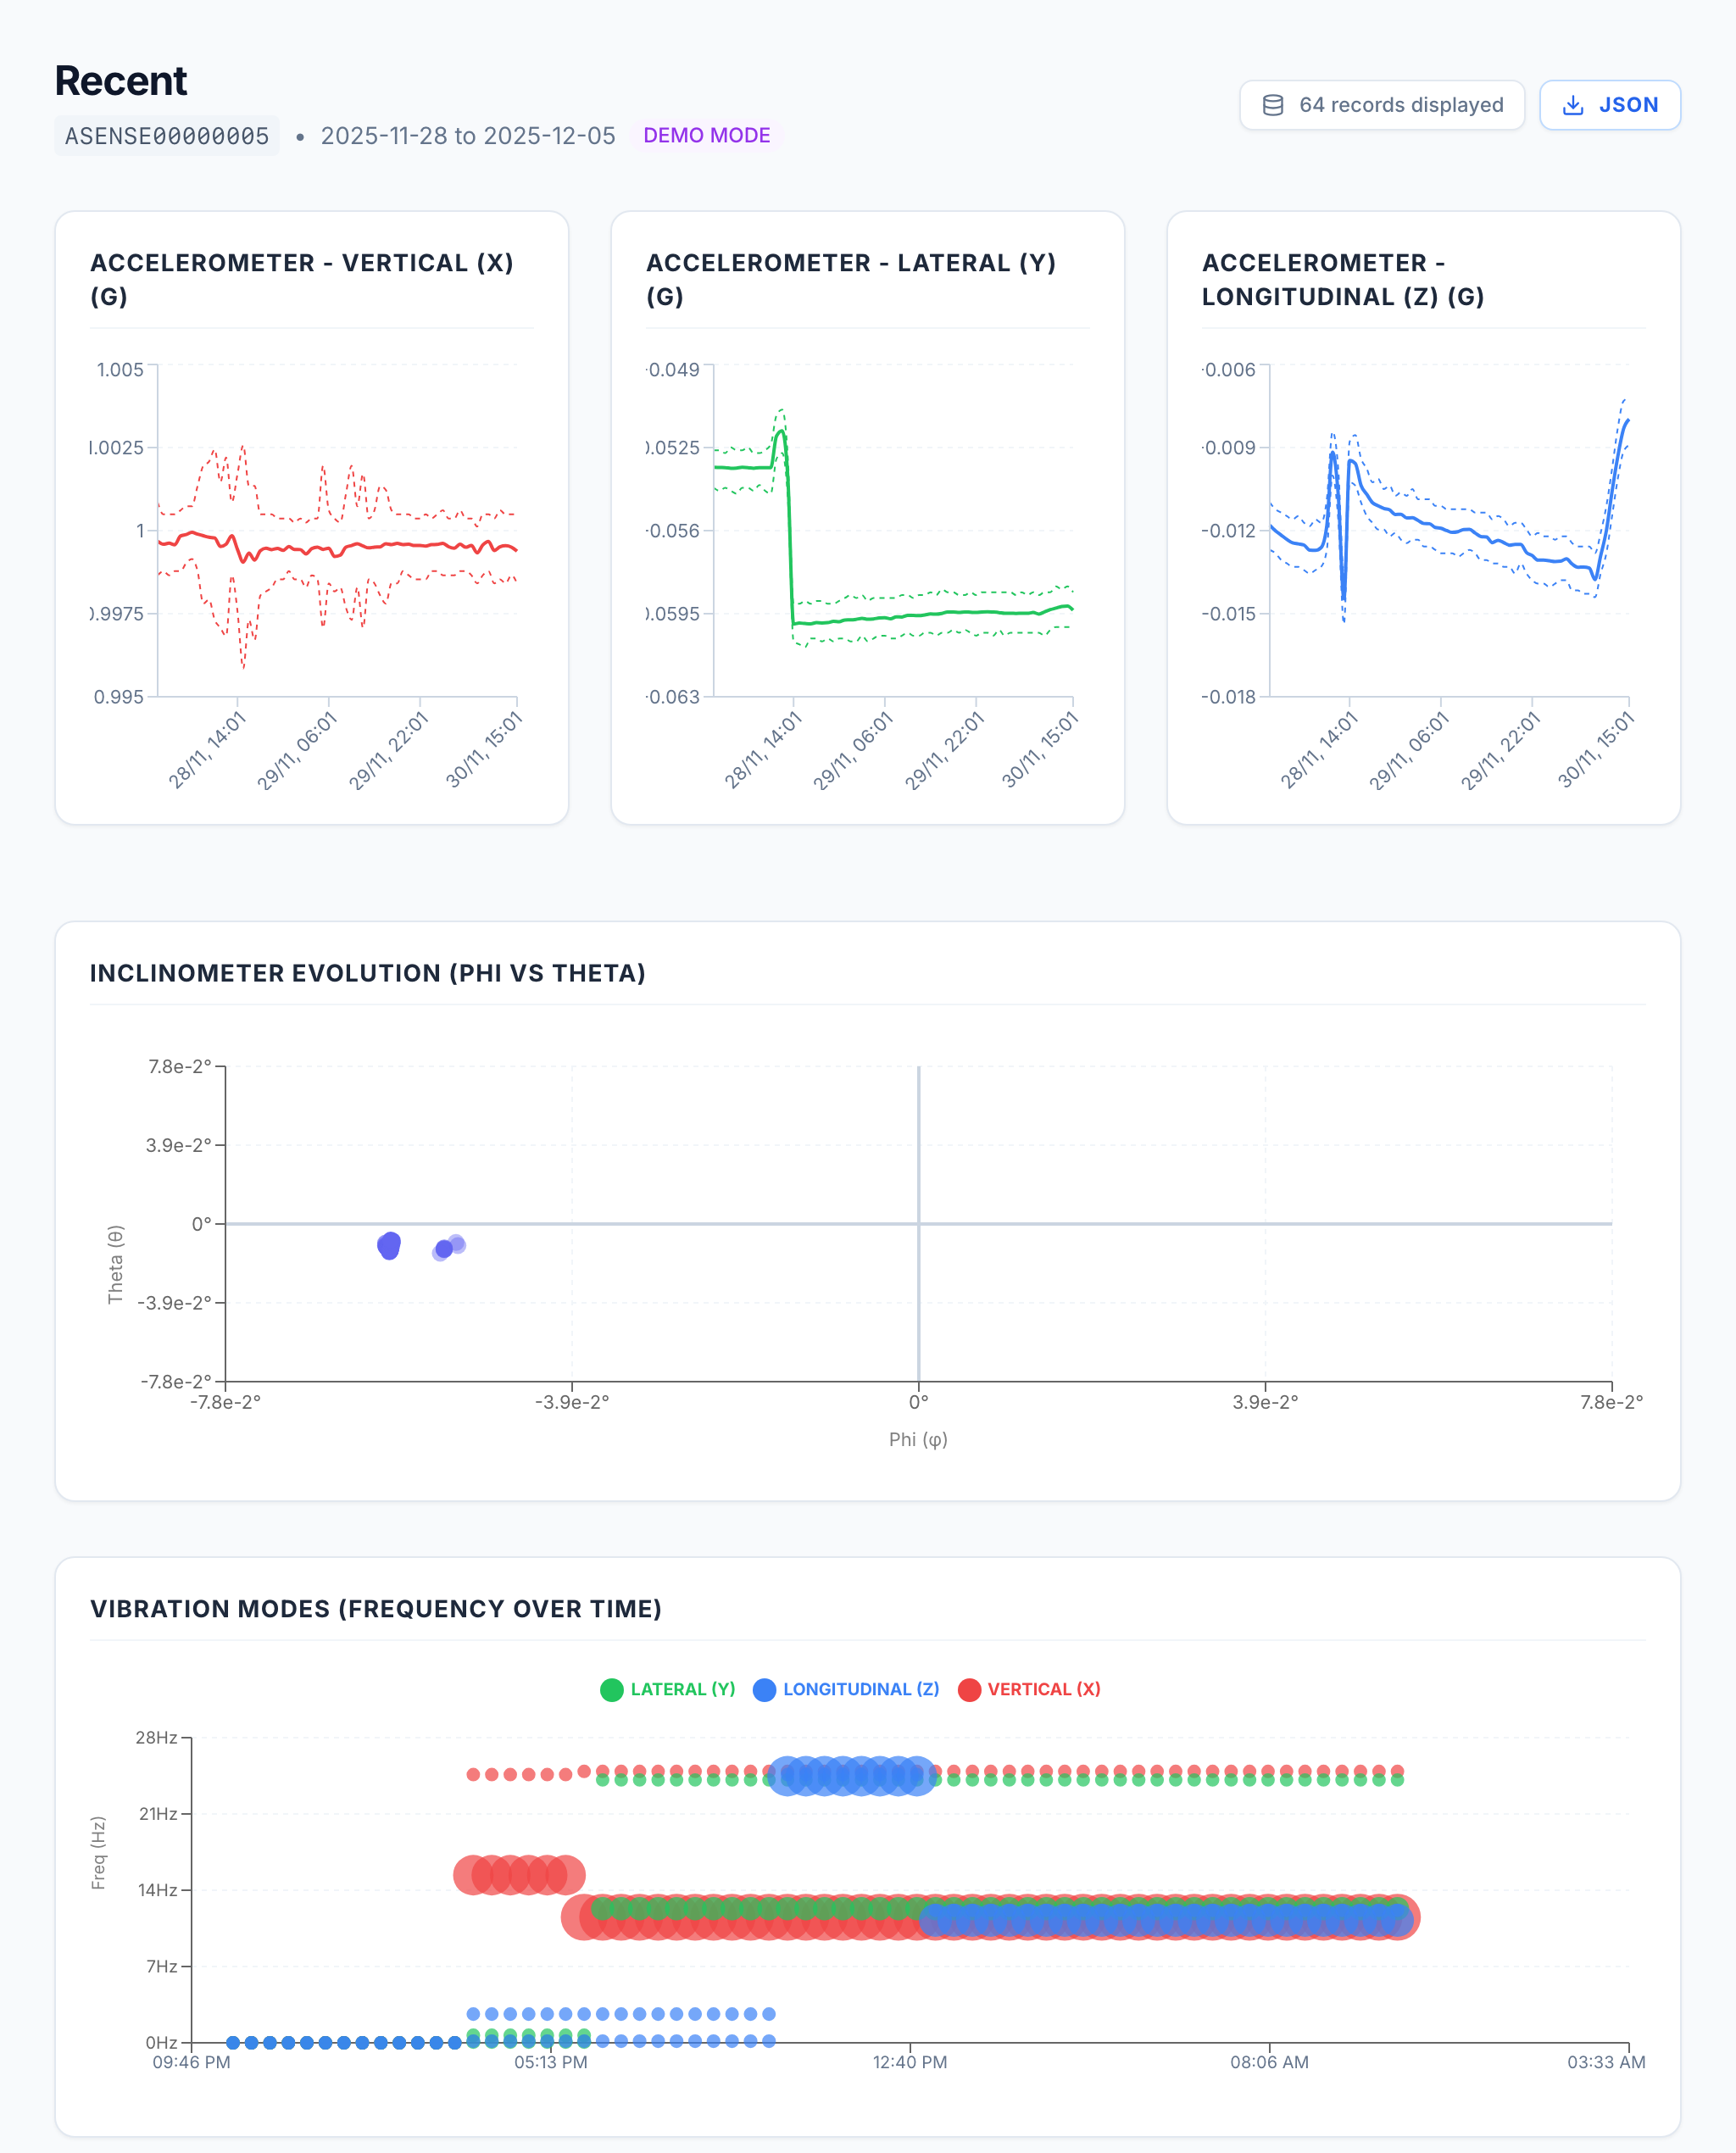
Recent: hourly trends
ABC
A
Acceleration Hourly average per axis, with the maximum and minimum as dotted lines.
B
Inclinometer How the two tilt angles move over time.
C
Main frequencies The strongest vibration frequencies of each axis, hour by hour.
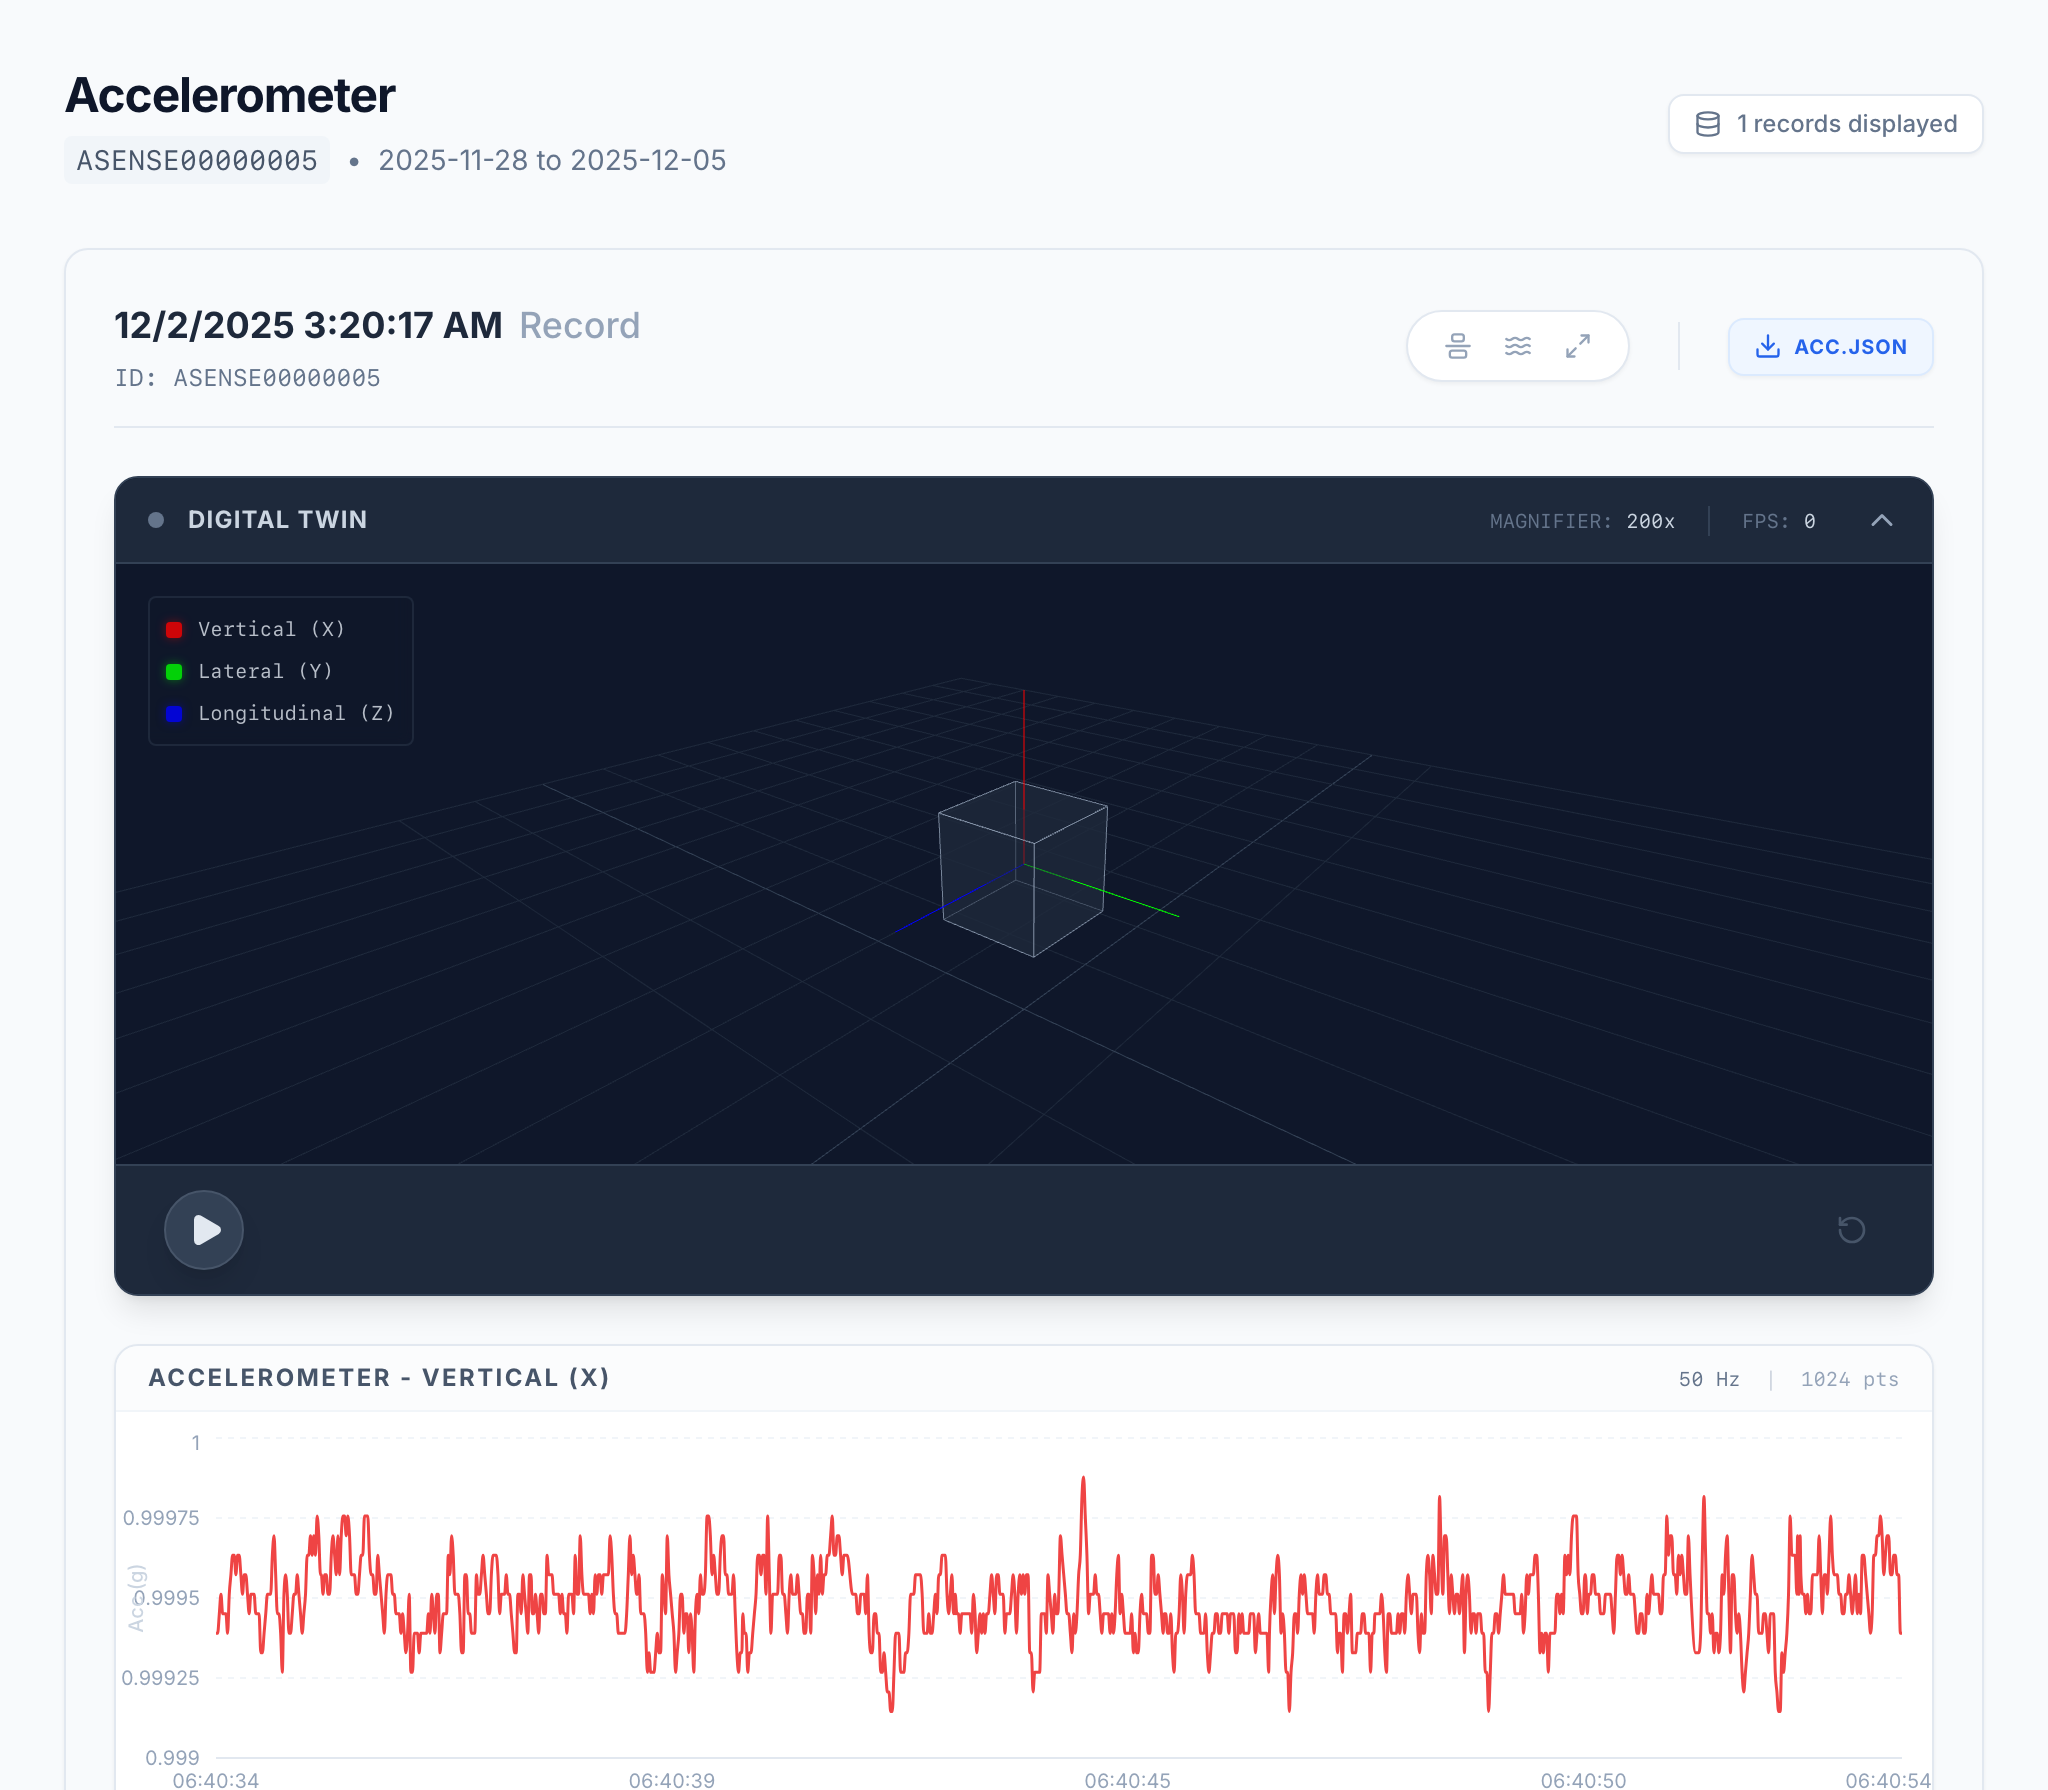
Accelerometer · Gyroscope: vibration recordings
ABCD
A
Recording Date and time of the 40 s recording.
B
Export Download the recording as JSON.
C
3D view Press play to replay the motion.
D
Traces One chart per axis, 50 samples per second.
The Gyroscope page has the same layout, for rotation.
Spectroscopy · Month
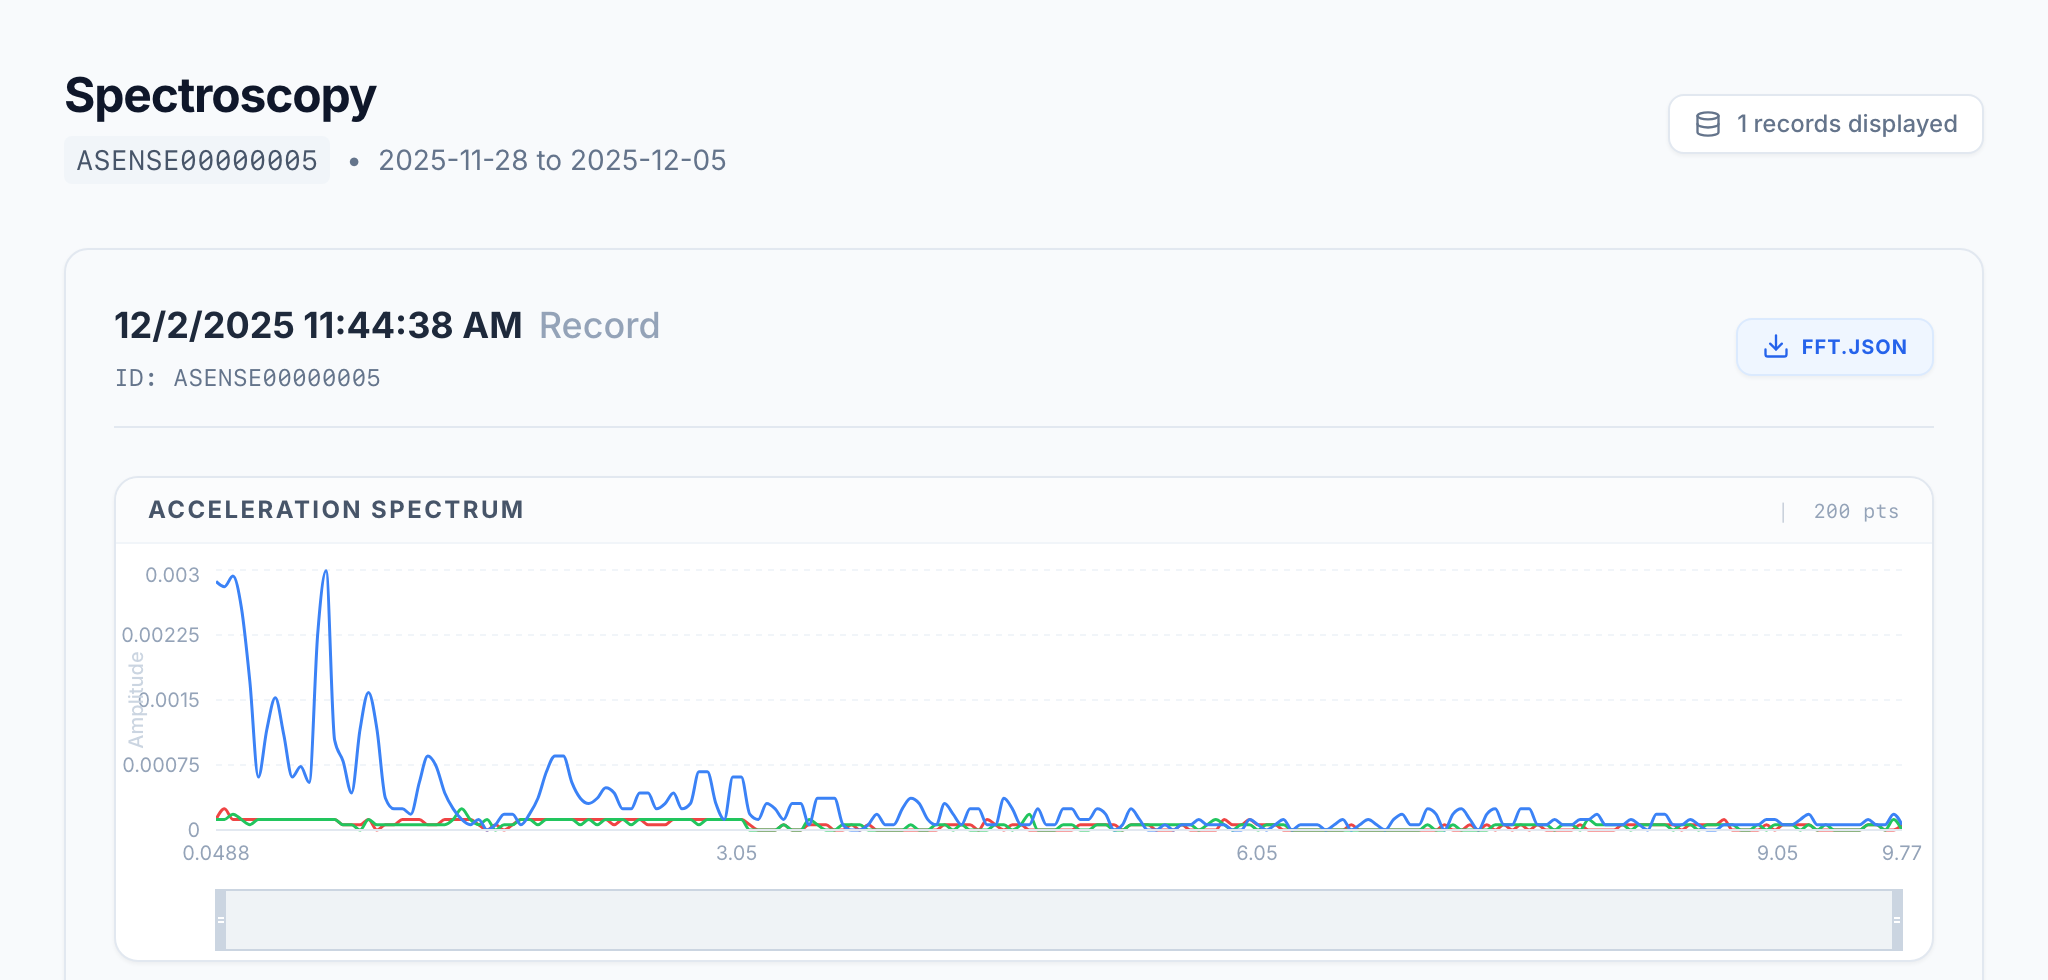
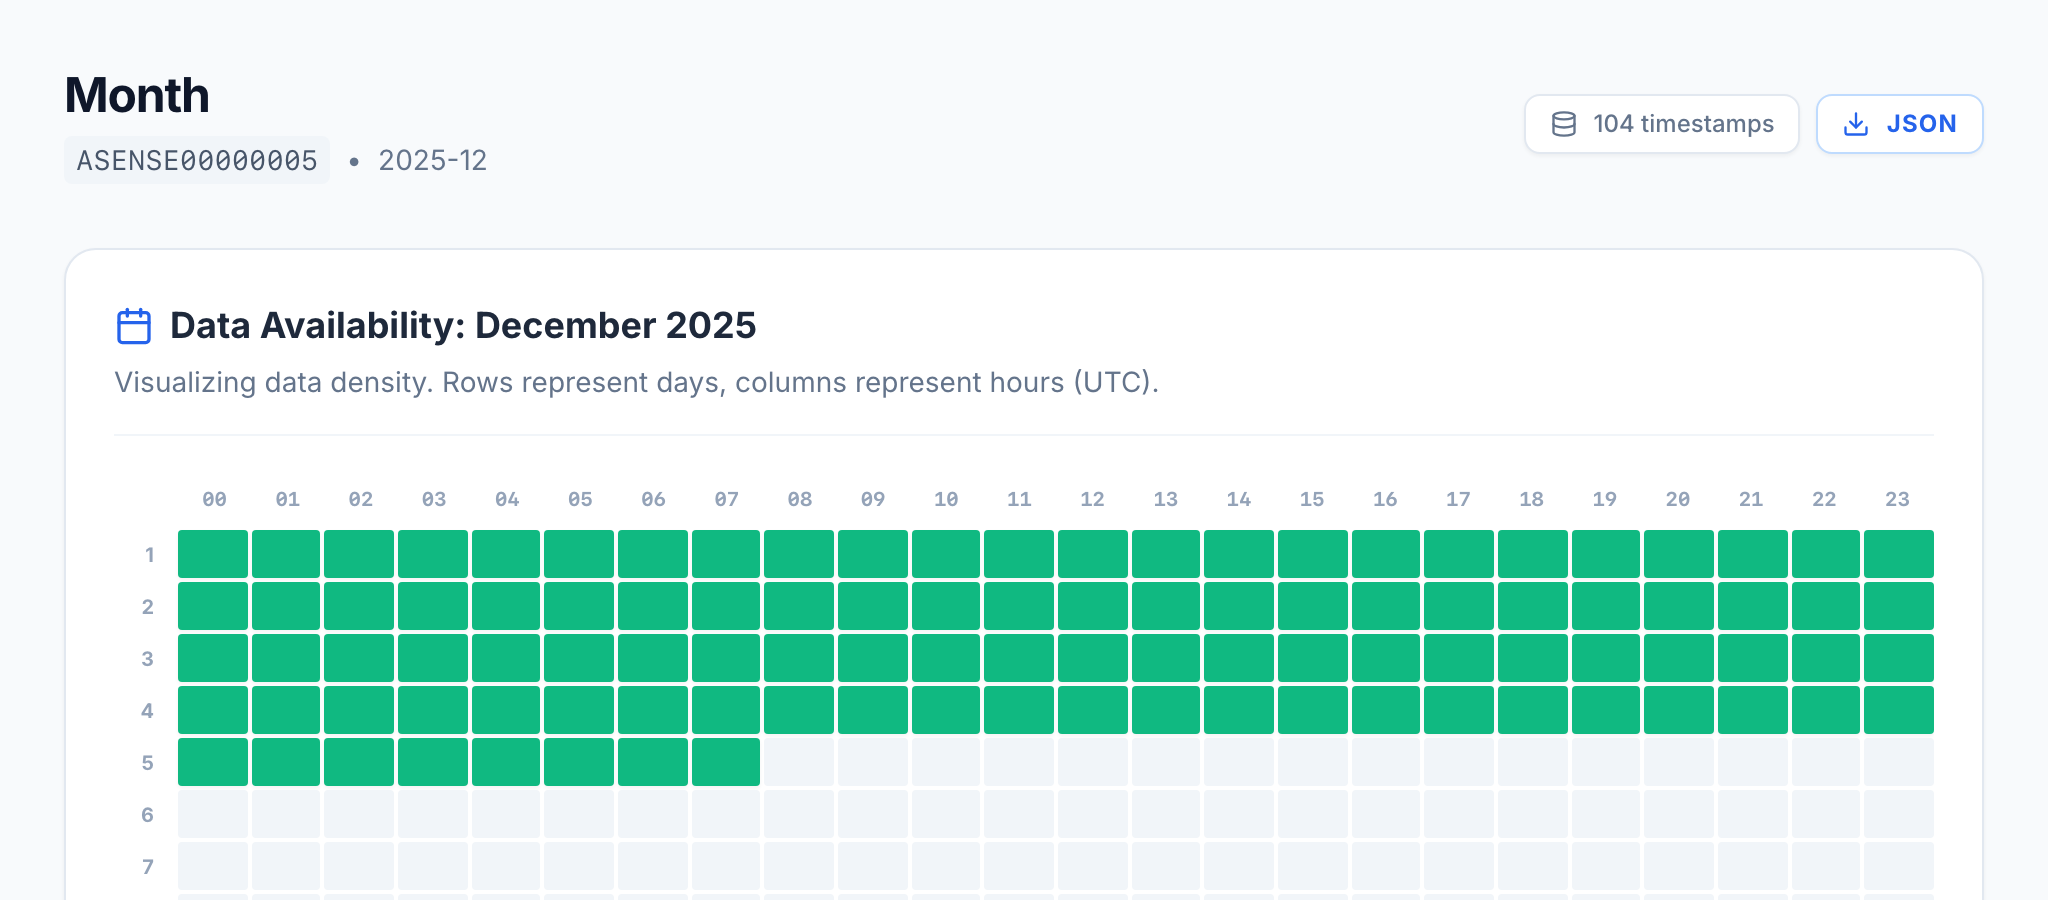
Spectroscopy: the hourly spectrum of each axis. Month: which hours have data; rows are days, columns are hours. All dashboard times are UTC.
5
What it sends
Three publications every hour, over LTE-M or NB-IoT.
Hourly summary
Acceleration
Average, maximum and minimum on each axis (g)
Tilt
Two inclination angles
Main frequencies
The two strongest vibration frequencies on each axis, with their amplitude
Wind
Speed and direction (16 sectors), plus six 10-minute average speeds
Strain gauges
Inputs A and B
Other
Ambient temperature, GPS position
Hourly spectrum
The frequency spectrum of each axis, 0 – 25 Hz in steps of about 0.05 Hz. It is the spectrum at the moment it is sent, not the hour's peak.
Vibration recording
Every hour the sensor keeps the 40 s around its strongest vibration and uploads them in full: acceleration and rotation on 3 axes, 50 samples per second. Both share one 32 kHz clock, so they line up sample for sample.